
Sustainability & ESG
Turn Operational Data Into Sustainable Outcomes
The data that runs a building efficiently is the same data that reports its environmental performance. Collecting it once, as a by-product of operations, is what makes reporting sustainable.
The business problem
ESG reporting rebuilt by hand every year
Consumption data is requested from finance, meter readings from engineering, waste volumes from the cleaning provider and maintenance records from a spreadsheet. The resulting report describes a year that has already closed, and its numbers cannot be traced back to anything operational.
The IntelliGrid approach
Measure, analyse, optimise, report
Consumption and operational data are captured continuously through metering, IoT and work records. Baselines make movement meaningful, anomalies become work orders, and reporting draws on the same dataset — so improvement and disclosure are the same exercise.
The sustainability dashboard
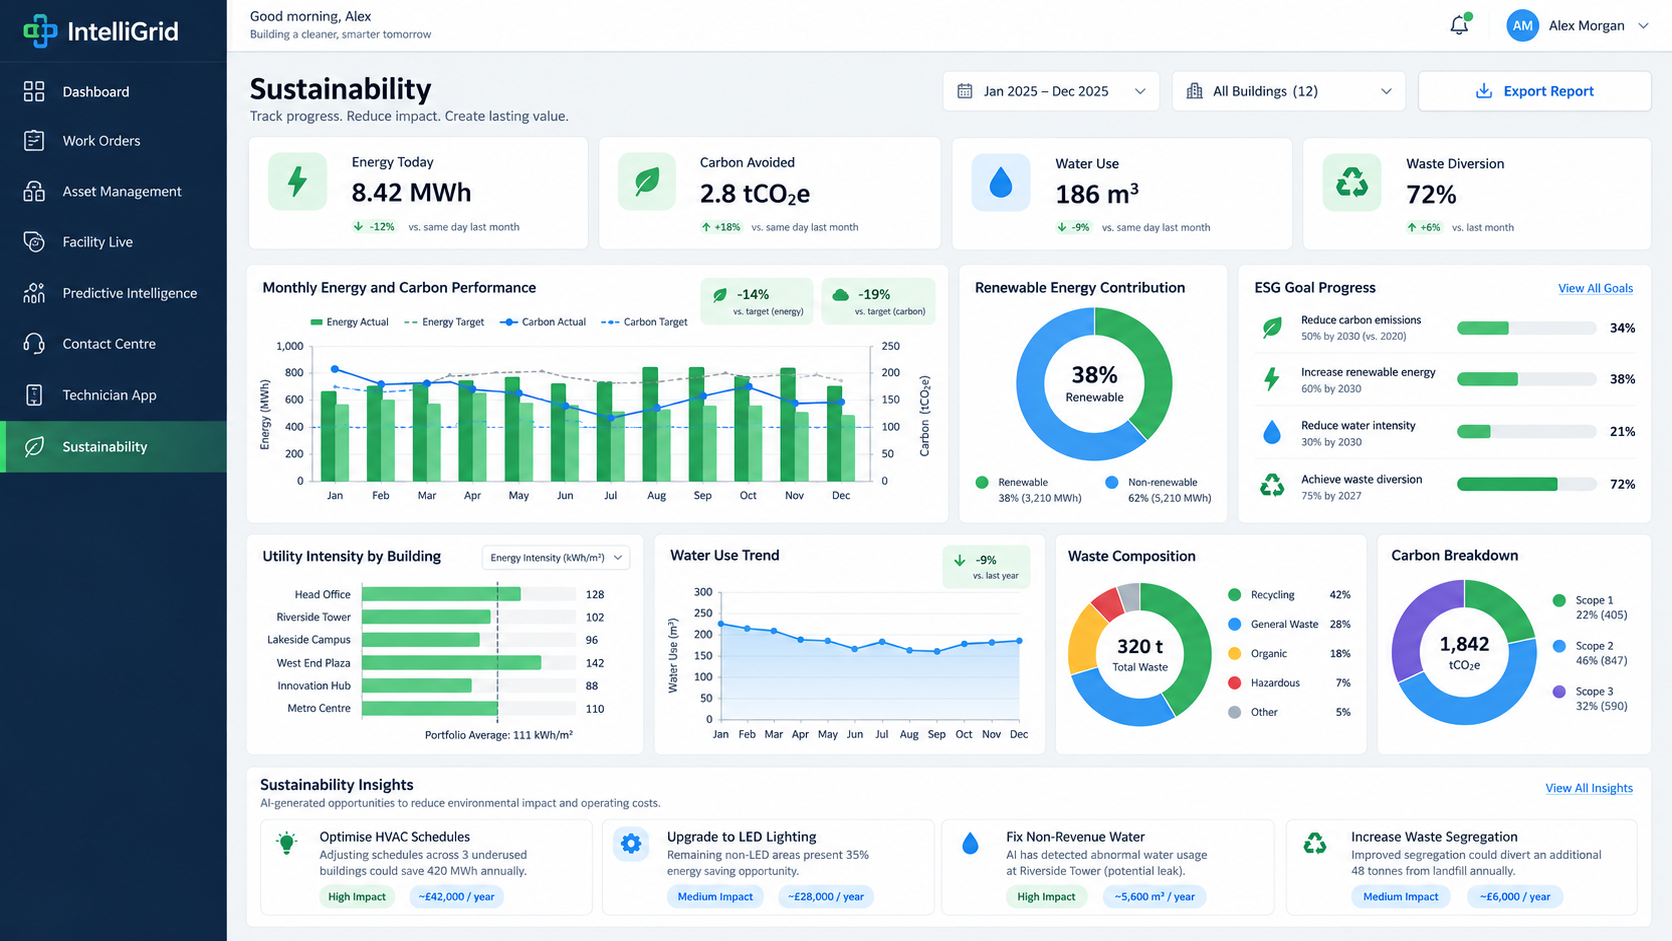
Interface shown with illustrative demo data.
Categories
What is tracked
Energy
Consumption, intensity, peak demand, building comparison and optimisation opportunity.
Carbon
Energy-related emissions tracked against a defined baseline.
Water
Consumption profiling, anomaly detection and site benchmarking.
Waste
Volumes and recycling performance where collection data is captured.
Assets
Equipment efficiency and condition as a driver of consumption.
ESG
Facility performance data prepared for disclosure and review.
Workflow
The sustainability cycle
Performance in a demo portfolio
Illustrative demo data — not verified customer outcomes.
↓ 8.5%
Energy usage
↓ 12.3%
Water usage
↓ 10.1%
CO₂ emissions
78%
Waste recycled
Business benefits
Connects with
Frequently asked
Can IntelliGrid track sustainability performance?
Yes. Energy, water, carbon and waste performance are tracked from metering, IoT and operational records, with baselines and portfolio benchmarking, and reported alongside service performance. Emissions tracking covers energy-related emissions; formal carbon accounting assurance is a separate exercise with your assurance provider.
Explore sustainability and ESG
We will look at your metering coverage and what reporting could be automated from it.