Dashboard & analytics
Turn Facility Operations Into Management Intelligence
The operational record, presented for the decision in front of you — a supervisor managing today’s queue and a director reviewing a portfolio work from the same data.
The business problem
Reporting that arrives too late to act on
Monthly packs are assembled by exporting from several systems into spreadsheets. By the time the pack circulates, the month is closed and the issues it describes have either resolved themselves or become expensive. Meanwhile the questions people actually ask — which building is worst, which contractor is slipping — require another manual exercise.
The IntelliGrid approach
One dataset, many views
Because operations run on one data model, reporting is a view rather than an export. Operational dashboards support the shift in progress; executive views compare buildings, contractors and periods on a consistent basis; and the underlying records remain available when a number needs to be explained.
Seven ways to slice the same data
Operational dashboards
Today’s queue, SLA risk, technician position and open incidents for the team on shift.
Executive dashboards
Portfolio performance, cost exposure, risk concentration and sustainability position.
Trend analysis
Period-on-period movement on work volume, SLA, energy and asset condition.
Filters and drill-through
Narrow by site, system, priority or provider, then open the underlying records.
Reports and exports
Scheduled or on-demand output for client reporting and board packs.
Scheduled reporting
Recurring distribution to named recipients without manual assembly.
The operations dashboard
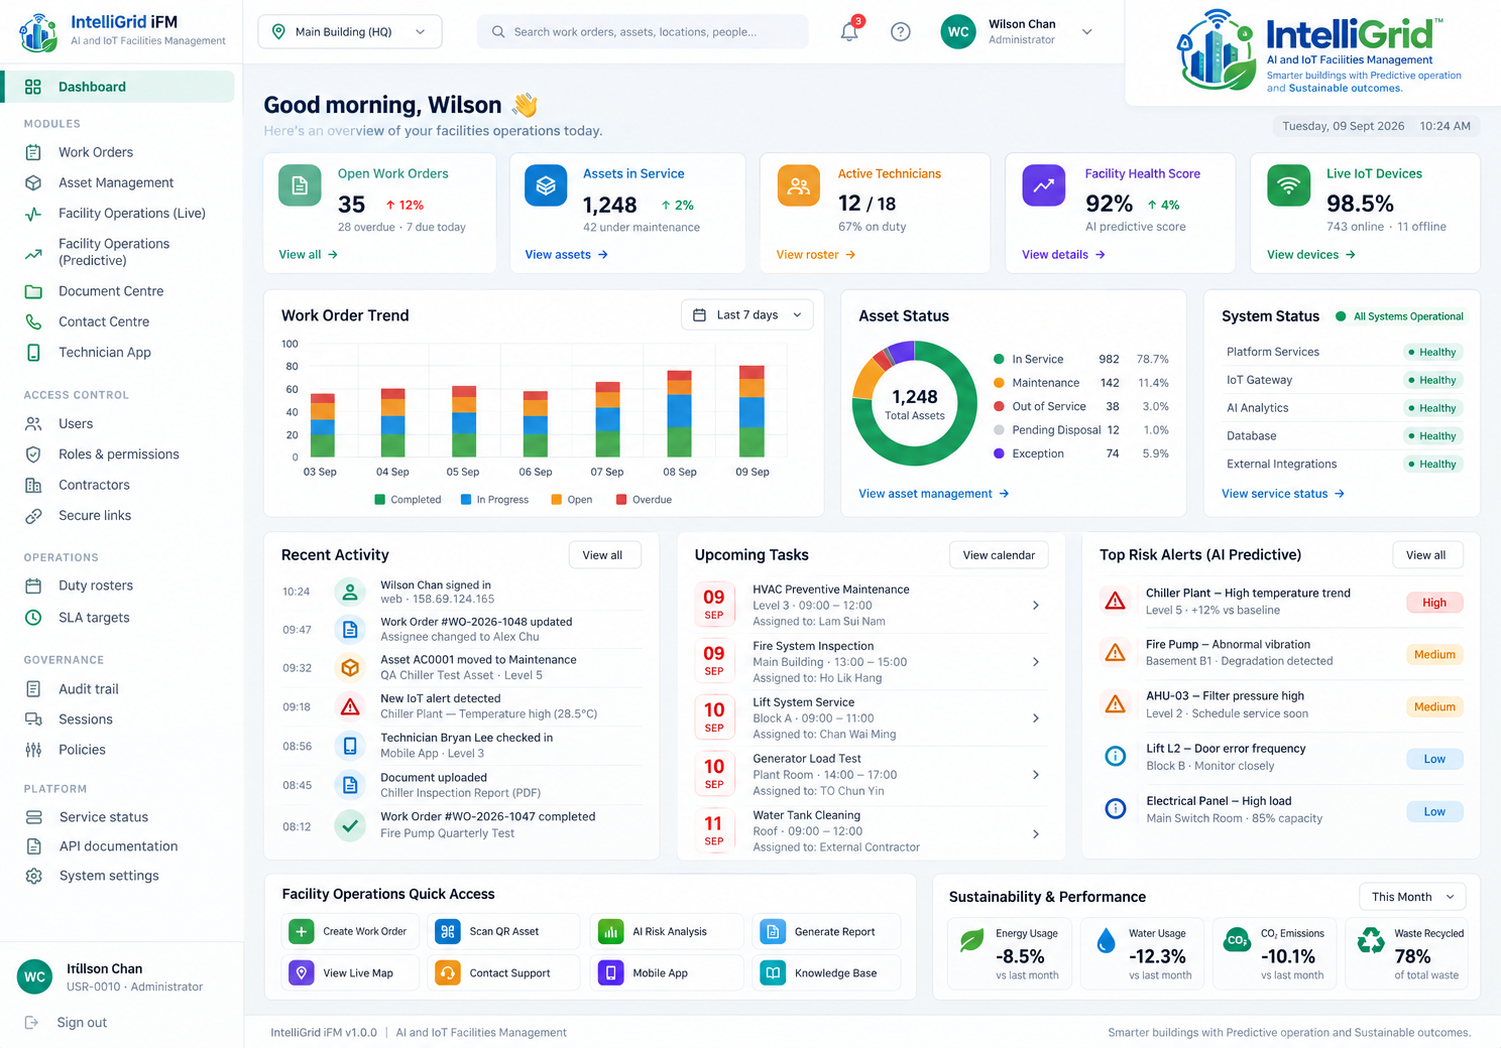
Interface shown with illustrative demo data.
KPIs
What the dashboards report on
Work orders
Open, overdue, completed, backlog trend, ageing and first-time fix.
Assets
In service, under maintenance, out of service, condition profile and criticality exposure.
Technicians
Active, utilisation, jobs completed and attendance against roster.
SLA
Compliance by category, priority, site and contractor, with breach causes.
System status
Connected building system and device health across sites.
AI risk
Current high, medium and low risk positions by building and asset class.
Energy
Consumption, intensity, peak demand and building comparison.
Water
Consumption trend, anomalies and site benchmarking.
Carbon
Energy-related emissions position against baseline.
Waste
Volumes and recycling performance where data is captured.
Business benefits
Connects with
See your facilities in one view
We will build a dashboard view around the decisions your team makes weekly.