Predictive operations
Move From Reactive Maintenance to Predictive Operations
IntelliGrid combines historical maintenance records, live equipment telemetry, alarms and operating behaviour to identify emerging risks before they interrupt facility operations.
The business problem
Fixed schedules service the calendar, not the equipment
Time-based maintenance treats every asset the same regardless of how hard it has been working. Equipment in light duty is serviced unnecessarily while equipment under stress deteriorates between visits, and the first sign of a real problem is often an occupant complaint or an emergency call-out at a premium rate.
The IntelliGrid approach
Condition, history and behaviour scored together
IntelliGrid establishes a baseline per asset from its own operating history, then watches for statistically meaningful deviation across telemetry, alarm frequency and runtime. Risks are scored against asset criticality so the queue reflects operational impact, and a recommended action can be raised as a work order with one step.
AI risk queue
What the operations team sees each morning
Illustrative operational data.
CH-01 Chiller
Supply temperature 12% above established baseline over 9 days
FP-02 Fire Pump
Abnormal vibration pattern detected during weekly test run
AHU-03
Filter differential pressure increasing steadily across 3 weeks
LIFT-07
Door cycle count approaching service interval threshold
The predictive intelligence screen
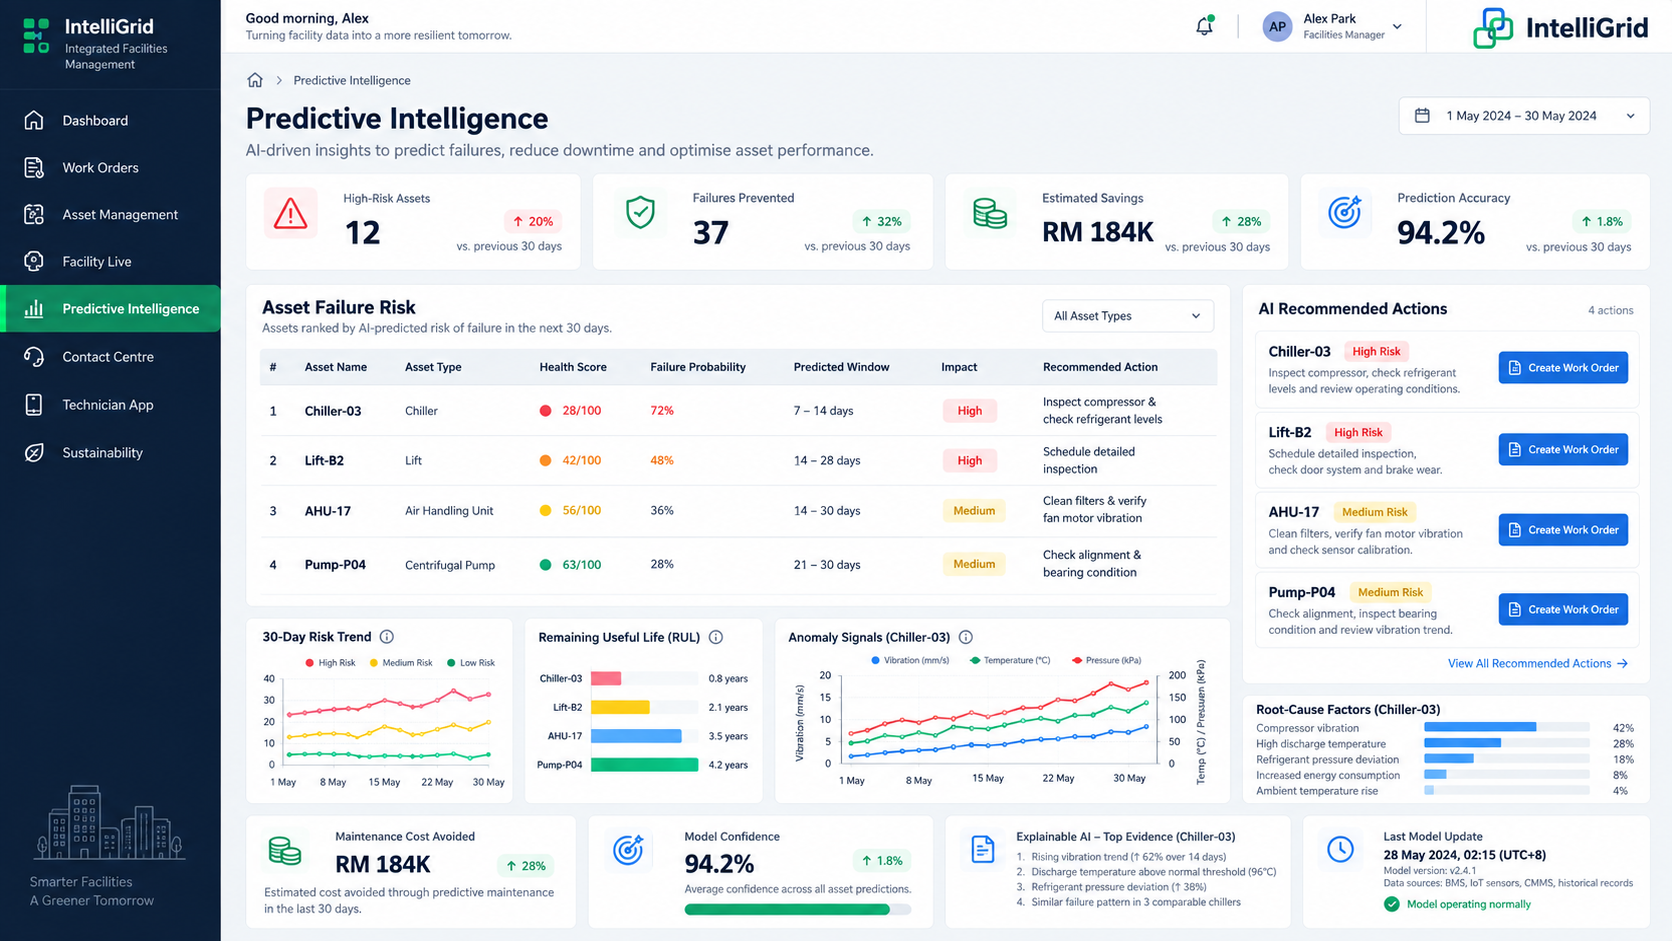
Interface shown with illustrative demo data.
Capabilities
Predictive capabilities
Capability depends on the telemetry available for each asset class. Deployments typically start with the equipment that carries the most operational risk.
Degradation detection
Gradual decline in performance identified against the asset’s own established operating baseline.
Temperature trend analysis
Rising supply, return or bearing temperatures tracked over time rather than judged by a single reading.
Vibration abnormalities
Changes in vibration signature on rotating equipment such as pumps, fans and motors.
Pressure anomalies
Differential pressure drift across filters, strainers and pumping systems.
Power anomalies
Current and power-factor changes indicating mechanical load or electrical fault conditions.
Runtime behaviour
Cycling frequency, run hours and duty patterns compared against expected operation.
Repeated alarm analysis
Recurring alarms on the same asset treated as a deterioration signal, not isolated events.
Asset history analysis
Fault and maintenance history weighted into the current risk position.
Predictive risk scoring
A single comparable score per asset so a portfolio can be ranked consistently.
Remaining-life indicators
Where sufficient history and telemetry exist, an indicative remaining-life position to support replacement planning.
Workflow
From data to scheduled work
STEP 1
Data Collection
Telemetry, alarms, runtime and maintenance history gathered per asset.
STEP 2
Baseline
Normal operating behaviour established from the asset’s own record.
STEP 3
Anomaly Detection
Deviation identified across one or more signals.
STEP 4
Risk Scoring
Severity weighted by asset criticality and service impact.
STEP 5
Recommended Action
A specific intervention proposed for review.
STEP 6
Work Order
Approved action scheduled, assigned and tracked to closure.
Predictive position across a demo portfolio
Illustrative demo data — not verified customer outcomes.
94%
Model confidence on flagged assets
3
Assets at high risk this week
1,248
Assets under monitoring
21 hrs
Indicative downtime avoided
Business benefits
Connects with
Frequently asked
How does predictive maintenance actually work here?
IntelliGrid builds a baseline of normal behaviour for each asset from its own telemetry, alarm and maintenance history. Deviation from that baseline is scored against the asset’s criticality, and a recommended action is proposed. It is a decision-support queue reviewed by your team, not unattended automation.
How much data is needed before predictions are useful?
Anomaly detection against a baseline becomes meaningful within weeks of continuous telemetry. Longer-horizon indicators such as remaining-life positions require more operating history and are introduced per asset class as data accumulates.
See predictive operations in action
We will show the risk queue, scoring model and work-order handoff against equipment classes you operate.